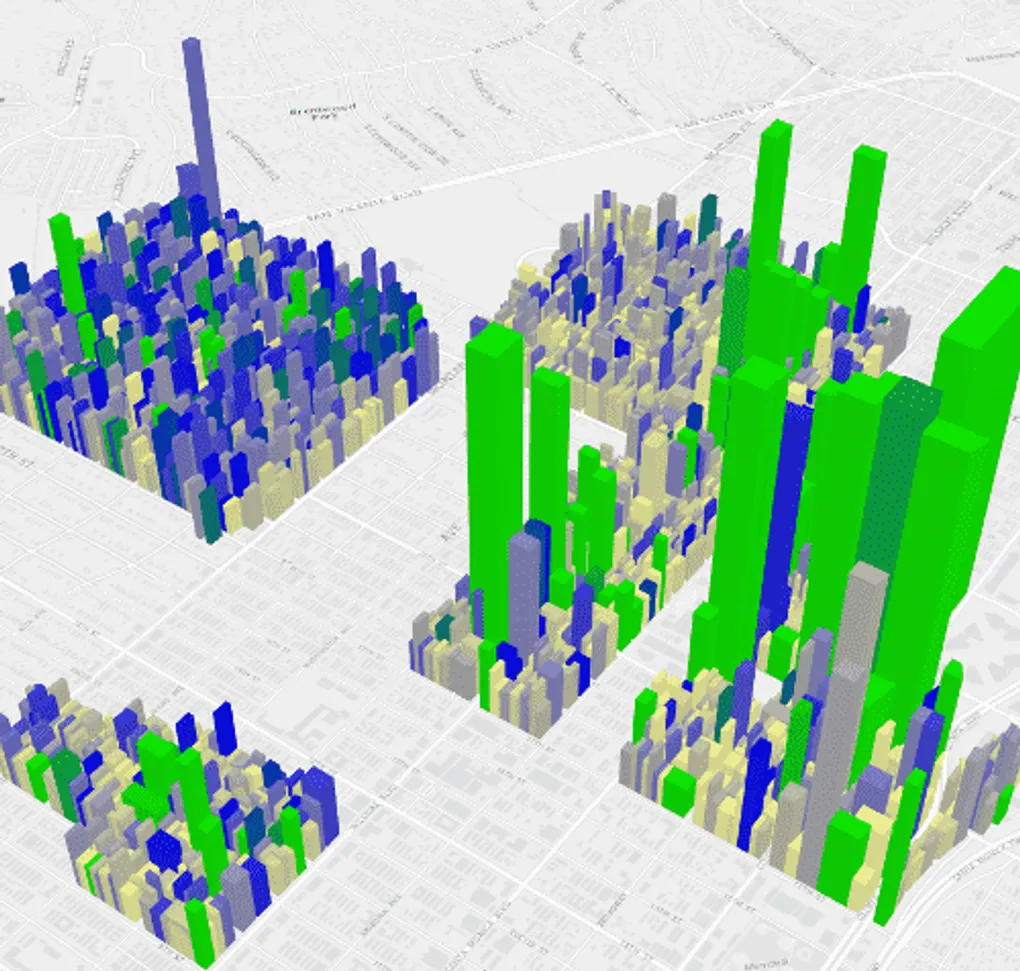
Visual Variables in ArcGIS API 4 for JavaScript
The ArcGIS API for JavaScript includes some great tools for being able to create visualizations of your data in your applications.
You can read more details about Visualizations and Visual Variables in the documentation.
The tooling available to developers in the ArcGIS API for JavaScript to be able to visualize their data is very powerful. Ideally, you may want to Smart Mapping on the platform, but you’re not limited to that. You can customize how you want to visualize your data in a very specific way.