
ArcGIS Online for Developers
There was a time where I was confused about ArcGIS Online. I was primarily a desktop user, an ArcMap warrior. I think I was still honing my Flex chops when ArcGIS Online was introduced. It started as an interesting concept, being able to share data online, having some basic map making features, but I didn’t really think much of it at the time. As time went on, I begin to look at ArcGIS online and all the services it provided. As a developer, I was intrigued.
However, I still see some developers struggle with ArcGIS Online and how to get started, so I thought I would give you a quick intro on how you might be able to take advantage of ArcGIS Online for your applications and more importantly, for your users.
Let’s cover some main points:
- The developer account.
- Creating data.
- Sharing.
Developer Account
I covered how to set up an ArcGIS Developer account in detail in my book, shameless plug. But basically, you are able to create an account that gives you access to premium content and services with 50 credits a month. How much does 50 credits give you? It can vary based on the premium services you use from the Location Services, which is stuff like Geocoding, Routing and GeoTriggers. I can tell you this much, when I was using my developer account to prototype applications for users, I never ran into a credit limit issue, so 50 credits can go a long way for development purposes. I wouldn’t try generating tiles using ArcGIS Online, that’s silly, regardless of what online service you use for tiles. Generate your tiles locally in ArcGIS desktop and then publish to ArcGIS Online and voila, you have tiles. Editing data in ArcGIS Online doesn’t use credits, so add data until your fingers bleed.
You will want to use the developer site to add a new Feature Service, which I won’t walk you through as that portion is not too difficult and I do walk you through step by step in my book. But once you have a Feature Service created, what do you do next?
This is where you have some options. You can go ahead and use the Feature Service as shown in the ArcGIS API for JavaScript samples or really any other API, SDK or application builder as shown on the developers site. You can also simply edit the data in ArcGIS Online or do something with your collected data. Go to you developer account, click on Hosted Data and then click on your Feature Service. You should see an Edit in ArcGIS Online button in the upper right as shown below.

Creating Data
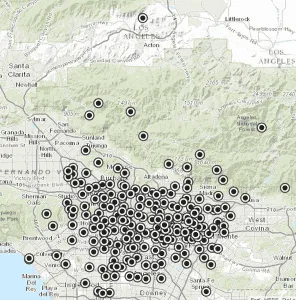
Now we are in an environment where you may want to create some data or maybe do something with the data that has already been collected. If you are not familiar with the ArcGIS Online map viewer, this may seem a bit intimidating at first, after all there are a lot of buttons and options as you hover over items. Don’t sweat it, we’re going to cover only what we need to. I have some data that is just a collection of points.
Go ahead and click on the Analysis button in the toolbar.
You get a new sidebar to Perform Analysis. This is where ArcGIS Online gets really interesting for developers. You can now take your data that you might have written an application for that has collected various points of interest. That alone may be sufficient depending on what you want to use it for. But maybe you want to do something a little more impressive with your data. ArcGIS Online provides lots of various analysis tools you can use to make your data more meaningful, but for now let’s keep it simple and just look for some patterns. Click on Analyze Patterns and then Hot Spots.
![analyze-patterns]
Now you are presented with a new sidebar menu as shown below.
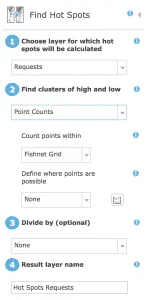
We’ll keep the defaults to run this analysis. Now, why would I care about this particular analysis. Let’s assume my dataset is a collection of requests from the public to fix some problem with streets. This could be a street light is broken, stop sign missing or maybe a sidewalk damage by tree roots. A hot spot analysis can be used as a way to visualize where activity is happening, so in this case maybe where a city is spending money to fix problems that could help someone make decisions such as initiate upgrades in infrastructure. This type of analysis could be a starting point for this process.
I should also point out that just because you can perform this analysis on your data doesn’t make it valuable. The old classic, How to lie with maps might be a good read if you are more interested.
At this point, you can click on the Run Analysis button at the bottom of the sidebar and wait for the analysis to finish. When done, I get a result that looks like below.
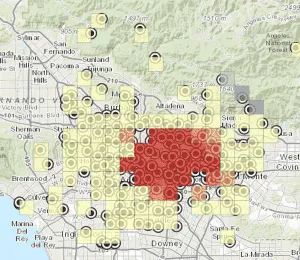
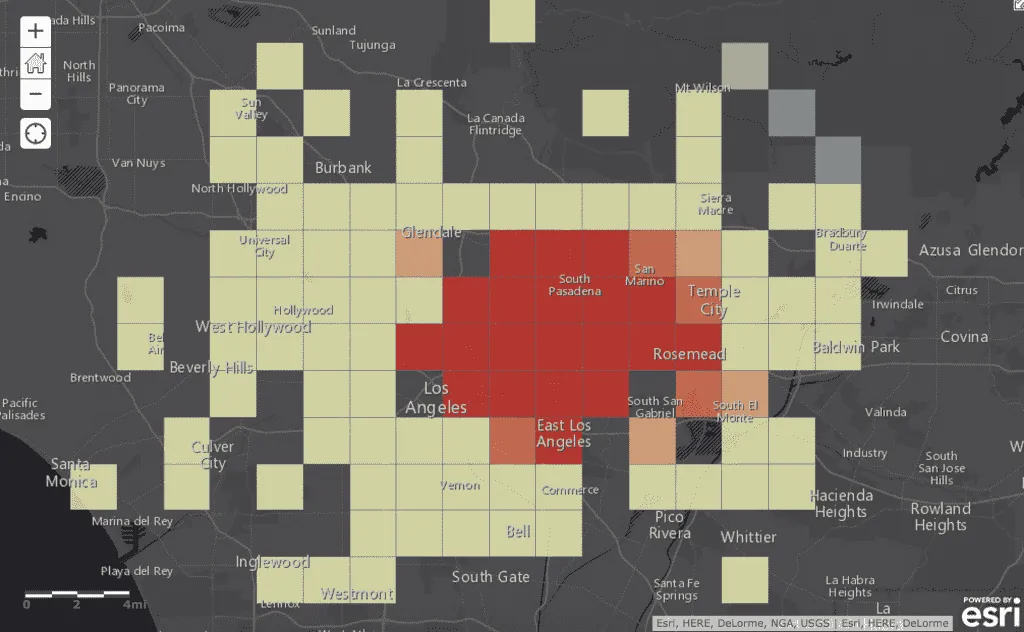
The analysis run shows a definite red area in the center indicating a high cluster of collected data. This map isn’t very good looking yet, so let’s make it look good.
Click on the Basemap button and select Dark Gray Canvas.
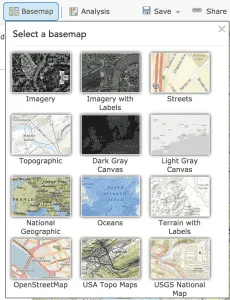
Then I’ll zoom in a little bit more to the area I’m interested, turn off my points, and get a map like below.
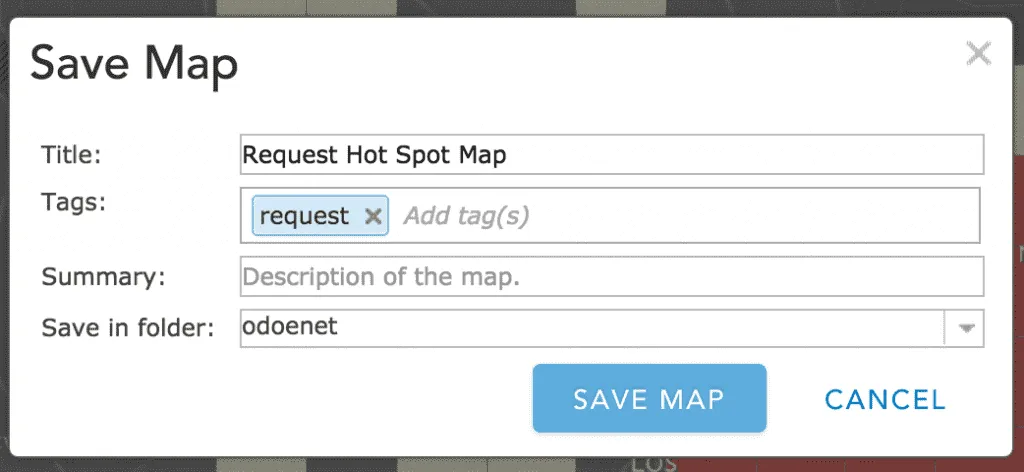
At this point, I’ll save my map by clicking the save button, give it a name and provide the required tags.
Sharing
Now I’ll share my map by clicking the Share button. I’ll share to everyone. Now at this point, when you share a map, you also will be sharing all the underlying data that comprises the map. You will be prompted to update the sharing of the dependent services. So keep this in mind when sharing maps that you aren’t also sharing data you may not want to.
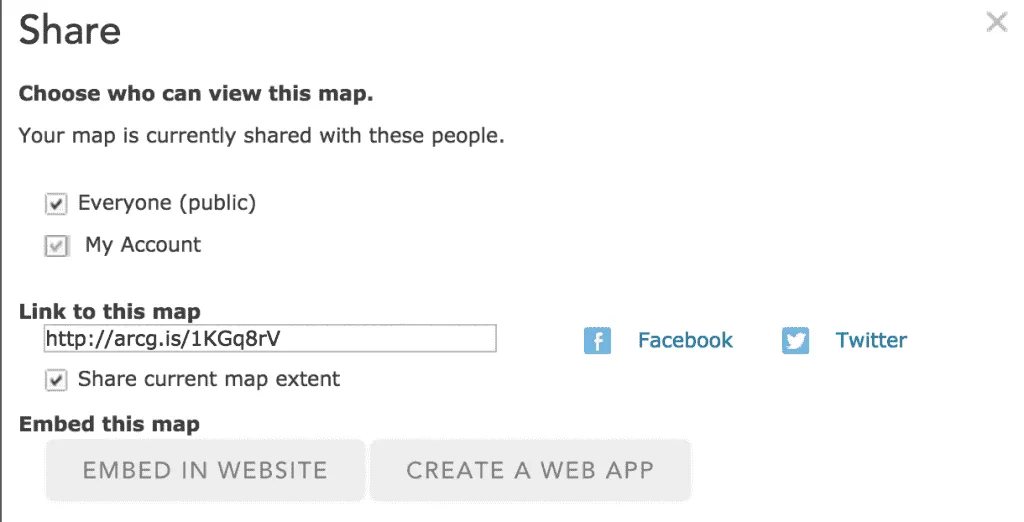
Now you can use this link to share with other people or use the webmap id to bring this map into your applications. You can find the webmap id in the URL to your webmap as shown below.

You can use this in the ArcGIS API for JavaScript by using the esri/arcgis/utils module.
Conclusion
This was just a quick introduction on how you as a developer can incorporate ArcGIS Online with your free ArcGIS developer account to create more interesting maps with your data. We barely skimmed the surface of ArcGIS Online capabilities, but fear not, I have a special project underway for those interested in getting more familiar with how they can incorporate ArcGIS Online and their Developer account to help them build applications and provide more value to their users. Stay tuned in the coming weeks for more information.
Until then, don’t be afraid to dig into ArcGIS Online with your Developer account and create some interesting maps, poke around the features and get your hands dirty!