Client Side Fun with ArcGIS API for JavaScript
One of the really powerful and fun features of the ArcGIS API for JavaScript is the ability to do some cool client side analysis with your data.
Most of the time, you will be working with a FeatureLayer in your apps. You will most likely be consuming a hosted feature service. I’ll do another blog at a later date talking more about feature services and their benefits, but for now, just know that they are a really powerful way to deliver spatial data.
Another simple, but popular format to deliver spatial data is GeoJSON. GeoJSON is a nice transport format because it is simple, and although you could deliver data in any spatial reference, technically the spec only allows WGS84 now. Remember I said GeoJSON is a transport format, it’s not really meant to be a storage format, but that is neither here nor there.
What if you wanted to consume GeoJSON in the ArcGIS API for JavaScript? There is a sample for that, and there is even one to reproject the data on the fly. They are both really cool, but how cool would it be to treat your GeoJSON like it came from a FeatureService.
Let’s try it out with the earthquake sample I just showed you.
What the sample above is doing is creating an empty FeatureLayer, with no url.
Since GeoJSON has no metadata, we need to let the FeatureLayer know some
information about the data with the fields property. This is an array of
Field’s
that describe if the field is a string, numeric, a date, plus any field aliases
that might be used for labels or in the popup. Then you can provide an
ObjectId field the FeatureLayer will use internally.
I am going to do it a little differently from the sample in that I am going to create my FeatureLayer up front with an empty source. This way my Legend is ready to go when my application starts and then I can use the applyEdits method to update my FeatureLayer with the results of the GeoJSON request.
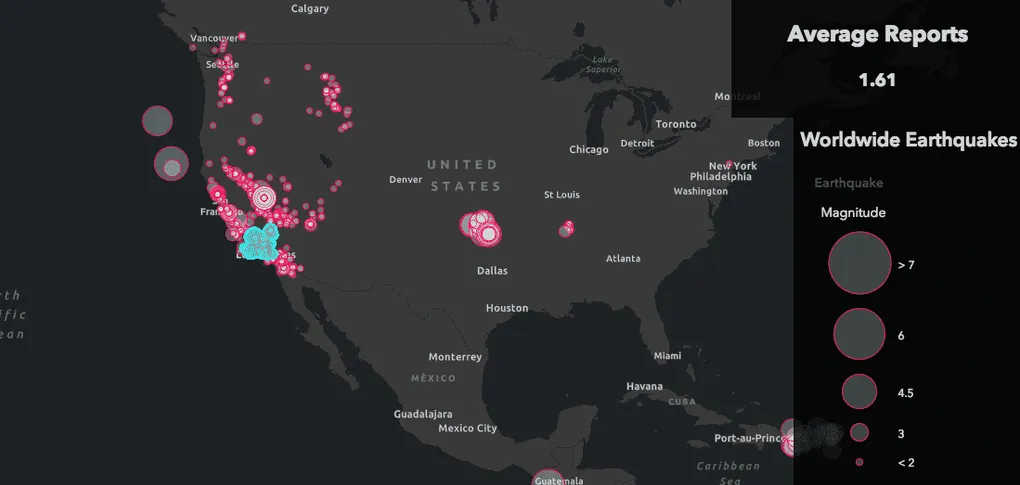
I’m going to use the FeatureLayerView in my app to query the data directly in the client. I’m going to do this when I click and drag on the map.
First thing to do is define the query.
const query = layer.createQuery();
query.set({
  geometry: view.toMap(event),
  distance: 100,
  units: "miles",
  outStatistics: [{
    onStatisticField: "felt",
    outStatisticFieldName: "felt_avg",
    statisticType: "avg",
  }],
});
In this snippet, we define a StatisticDefinition for our query. I’m just going to calculate the average, but there are a number of statistics you can do on the client.
Once we have our query prepared, we can perform two queries. Once to get the result of our statistics and one to get the ids so that we can highlight those features on the map. This is why you need to tell the FeatureLayer about the ObjectId field, so you can do cool things like highlight those features!
layerView.queryFeatures(query).then(({ features }) => {
  const result = features[0];
  if (result) {
    avgValue.innerText = result.attributes.felt_avg.toFixed(2);
  } else {
    avgValue.innerText = 0.00;
  }
});
layerView.queryObjectIds(query).then((ids) => {
  if (highlight) {
    highlight.remove();
    highlight = null;
  }
  highlight = layerView.highlight(ids);
});
Doing this allows us to hover over the map, highlight the features we run our statistics on and display the results in a panel on the page.
You can see this demo in action here.
This sample barely scratches the surface of what you can do with client side statistics. For a more robust use case, check out this sample in the SDK that uses SQL queries in the statistics queries! Not bad for loading some simple GeoJSON into an ArcGIS API for JavaScript app right!
The client-side capabilities of the JavaScript API are silly powerful, not only for Feature Services, but also any data that you want to add to your apps in a FeatureLayer. Happy geohacking!